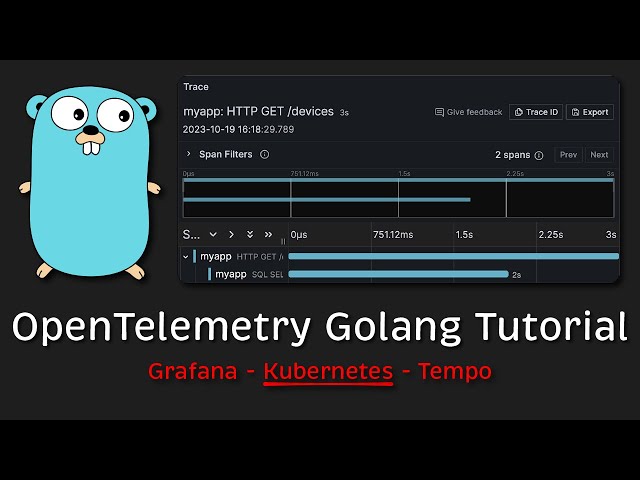
Distributed tracing with OpenTelemetry in Go is a powerful technique for tracking the flow of requests through a distributed system. It allows you to visualize the path of a request as it travels through different services, and to identify any bottlenecks or errors that may be occurring.
import ("context""fmt""io""go.opentelemetry.io/otel""go.opentelemetry.io/otel/attribute""go.opentelemetry.io/otel/codes""go.opentelemetry.io/otel/sdk/trace")func main() {// Create a new tracer provider.tp := trace.NewTracerProvider()otel.SetTracerProvider(tp)// Create a new tracer.tracer := otel.Tracer("my-tracer")// Create a new context with the tracer.ctx := context.Background()// Start a new span.ctx, span := tracer.Start(ctx, "my-span")// Do some work.fmt.Println("Hello, world!")// Add some attributes to the span.span.SetAttributes(attribute.String("key1", "value1"),attribute.Int("key2", 123),)// End the span.span.End()}
Distributed tracing is especially useful for debugging complex systems, as it can help you to identify the root cause of a problem. It can also be used to improve the performance of a system by identifying bottlenecks and optimizing the flow of requests.
In this article, we will explore the basics of distributed tracing with OpenTelemetry in Go. We will show you how to create a tracer, start a span, add attributes to a span, and end a span. We will also provide some examples of how distributed tracing can be used to debug and optimize a system.
Exploring Distributed Tracing with OpenTelemetry in Golang
Distributed tracing is a powerful technique for tracking the flow of requests through a distributed system. It allows you to visualize the path of a request as it travels through different services, and to identify any bottlenecks or errors that may be occurring. OpenTelemetry is a vendor-neutral framework for collecting and managing telemetry data, including traces. It provides a set of libraries that can be used to instrument your code and collect tracing data.
- Observability: Distributed tracing provides observability into the behavior of your system. It allows you to see how requests are flowing through your system, and to identify any bottlenecks or errors that may be occurring.
- Debugging: Distributed tracing can be used to debug complex systems. By visualizing the flow of requests through your system, you can identify the root cause of a problem.
Distributed tracing is an essential tool for managing complex distributed systems. It provides observability into the behavior of your system, and can be used to debug problems and improve performance. OpenTelemetry is a vendor-neutral framework for collecting and managing telemetry data, including traces. It provides a set of libraries that can be used to instrument your code and collect tracing data.
Observability
Distributed tracing is a powerful tool for gaining observability into the behavior of your system. It allows you to see how requests are flowing through your system, and to identify any bottlenecks or errors that may be occurring. This information can be invaluable for debugging problems, optimizing performance, and ensuring the reliability of your system.
- Visualizing the flow of requests: Distributed tracing can be used to visualize the flow of requests through your system. This can be helpful for understanding how your system is performing, and for identifying any bottlenecks or errors that may be occurring.
- Identifying bottlenecks: Distributed tracing can be used to identify bottlenecks in your system. By visualizing the flow of requests, you can see where requests are taking the longest to process. This information can be used to optimize your system and improve performance.
- Identifying errors: Distributed tracing can be used to identify errors that are occurring in your system. By visualizing the flow of requests, you can see where errors are occurring and what is causing them. This information can be used to fix errors and improve the reliability of your system.
OpenTelemetry is a vendor-neutral framework for collecting and managing telemetry data, including traces. It provides a set of libraries that can be used to instrument your code and collect tracing data. OpenTelemetry is a powerful tool for gaining observability into the behavior of your system. It can be used to debug problems, optimize performance, and ensure the reliability of your system.
Debugging
Distributed tracing is a powerful tool for debugging complex systems. By visualizing the flow of requests through your system, you can see where errors are occurring and what is causing them. This information can be invaluable for fixing bugs and improving the reliability of your system.
OpenTelemetry is a vendor-neutral framework for collecting and managing telemetry data, including traces. It provides a set of libraries that can be used to instrument your code and collect tracing data. OpenTelemetry is a powerful tool for debugging complex systems. It can be used to visualize the flow of requests through your system, identify errors, and fix bugs.
For example, let’s say you have a complex system that is experiencing errors. You can use OpenTelemetry to collect tracing data from your system. This data can then be visualized in a trace viewer, which will allow you to see the flow of requests through your system and identify where the errors are occurring. This information can then be used to fix the errors and improve the reliability of your system.
Distributed tracing is an essential tool for debugging complex systems. It can help you to identify the root cause of problems and improve the reliability of your system. OpenTelemetry is a powerful tool for collecting and managing tracing data. It can be used to visualize the flow of requests through your system, identify errors, and fix bugs.
FAQs
This section addresses frequently asked questions and misconceptions about distributed tracing with OpenTelemetry in Go.
Question 1: What are the benefits of using distributed tracing?
Answer: Distributed tracing provides several benefits, including improved observability, faster debugging, and easier root cause analysis.
Question 2: How does OpenTelemetry help with distributed tracing?
Answer: OpenTelemetry provides a vendor-neutral framework and libraries for collecting, managing, and visualizing trace data.
Question 3: Is OpenTelemetry difficult to implement?
Answer: Implementing OpenTelemetry can vary in complexity depending on the size and complexity of your system. However, OpenTelemetry provides well-documented libraries and resources to simplify the process.
Question 4: Can OpenTelemetry be used with other tracing tools?
Answer: Yes, OpenTelemetry is designed to be interoperable with other tracing tools and frameworks.
Question 5: What are some best practices for using OpenTelemetry for distributed tracing?
Answer: Best practices include using meaningful span names, adding relevant attributes, and considering data sampling to manage the volume of trace data.
In summary, distributed tracing with OpenTelemetry in Go offers significant benefits for understanding and optimizing the behavior of distributed systems.
Transition to the next article section: In the next section, we will provide a hands-on example of using OpenTelemetry for distributed tracing in Go.
Tips for Exploring Distributed Tracing with OpenTelemetry in Go
To effectively utilize OpenTelemetry for distributed tracing in Go, consider the following tips:
Tip 1: Leverage Semantic Conventions
Adhere to semantic conventions when naming spans and attributes to ensure consistency and facilitate data analysis across different systems.
Tip 2: Optimize Data Collection
Configure OpenTelemetry to collect only essential trace data to minimize performance overhead. Utilize sampling techniques to manage the volume of data.
Tip 3: Integrate with Existing Tools
OpenTelemetry seamlessly integrates with popular tracing tools and visualization platforms. Leverage these tools to analyze and visualize trace data for deeper insights.
Tip 4: Consider Distributed Context Propagation
Ensure that trace context is properly propagated across service boundaries to maintain the continuity of distributed traces.
Tip 5: Utilize Context API
Utilize the OpenTelemetry context API to access and manipulate trace context within your code, enabling fine-grained control over tracing behavior.
Conclusion
In this article, we explored the fundamentals of distributed tracing with OpenTelemetry in Go. We discussed the benefits of distributed tracing, how OpenTelemetry can be used for distributed tracing, and some best practices for using OpenTelemetry for distributed tracing. We also provided some tips for exploring distributed tracing with OpenTelemetry in Go.
Distributed tracing is a powerful tool for understanding and optimizing the behavior of distributed systems. By following the tips and best practices outlined in this article, you can effectively utilize OpenTelemetry for distributed tracing in Go and gain valuable insights into your system’s performance and behavior.
Youtube Video:


